

The platform that gives you control and insight
SI Connect is a AI–driven, a system-independent platform that collects, structures and visualizes property data from operational, energy and management systems. For a clear overview, the right priorities and better decisions.

Mer kontroll och färre klick
Connect förenklar din vardag
Fastighetsförvaltning blir alltmer komplex med en vardag fylld av aktiviteter, larm, besiktningar, OVK, felanmälningar, identifierade förbättringsåtgärder, energidata m.m. Dessutom hanteras allt i olika system som inte är sammankopplade och kraven på datadrivna beslut ökar.
SI Connect samlar och kopplar samman all relevant data i ett och samma gränssnitt. Utifrån din roll skapar SI Connect en tydlig översikt över hur just dina fastigheter mår och hjälper dig att prioritera rätt aktiviteter.
Streamline property management
By bringing all properties and systems together in one platform, operations and management work is streamlined. We save time and resources while making the right decisions can reduce costs.
Visualize data regardless of system
SI Connect integrates relevant data from all your systems and visualizes it in one interface, creating a clear overview of how the properties are doing.
Order and order
Get full control over activities, inspections, fault reporting, alarms and energy – all gathered in a secure platform. SI Connect is flexible and adapts to your properties and systems, regardless of whether you have a few or a larger portfolio. A simpler everyday life, simply.
A colleague at hand
Our AI agents help you find insights, observations and analyses. You can query information from your systems and properties, create event alerts or generate reports. The more systems that connect to Si Connect, the more value can be created.
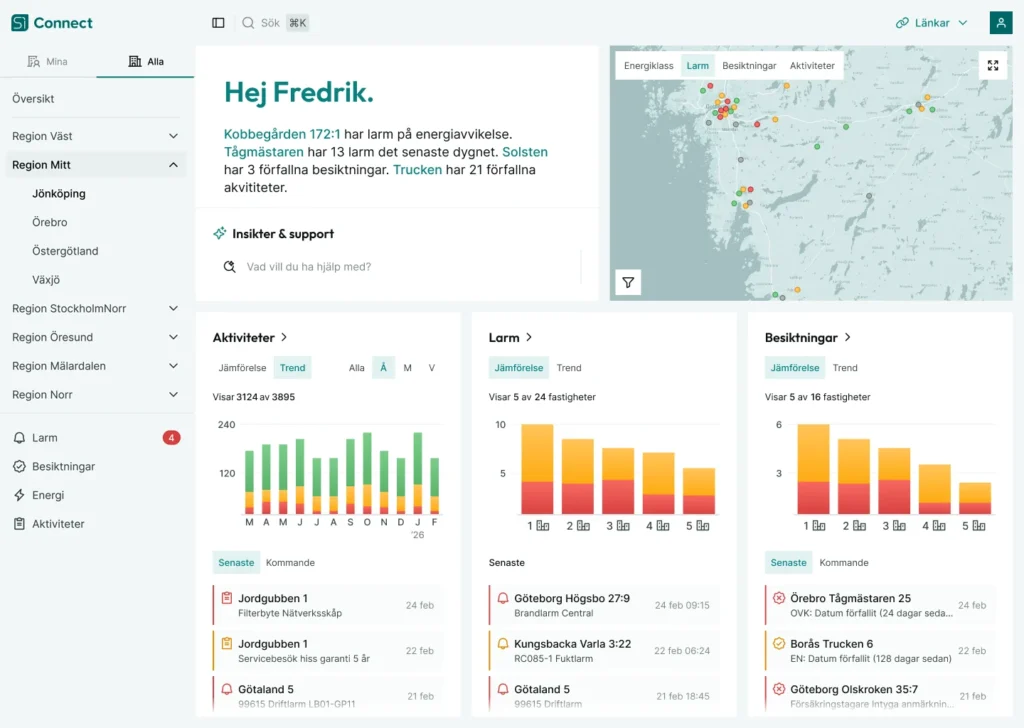
Overview that tells you what you need to focus on
Starta din dag med en tydlig överblick över hur dina fastigheter mår, och vilka aktiviteter du ska prioritera.
- AI: Generated insights, observations and analyses
- Alarm: Compare and see how alarms trend over time
- Inspections: Simple and quick control over what we need to prioritize
- Activities: My to-do list
- Map view: Filter by energy class, alarms, inspections, activities

Real estate
This collects specific property information and a clear overview of what needs to be done and prioritized.
- Property information: Choose which information is relevant based on your business. Cost center, address, areas, contact persons, operating company, etc.
- Overview: Alarms, inspections, activities and energy. Go further for more in-depth information.
- Links: Comprehensive view of the systems in the property with direct links.
- Analyses: With our integrated Smartware AI service, you can perform simple analyses on the operational data you choose.
AI - Insights & Analytics
When all systems are connected with structured data, our AI agents can create insights and analyses. You as a user can ask questions, create reports or watch for things you want to know and need to keep track of.
- Observations: Presented to you daily so you know what needs your attention.
- Search / ask: Search, ask questions, create reports on all your data.
- Coverages: Suggestions for events you should keep an eye on and create your own alerts.
- Insights: With our built-in AI service Smartware, it's easy to perform analyses that provide valuable insights.

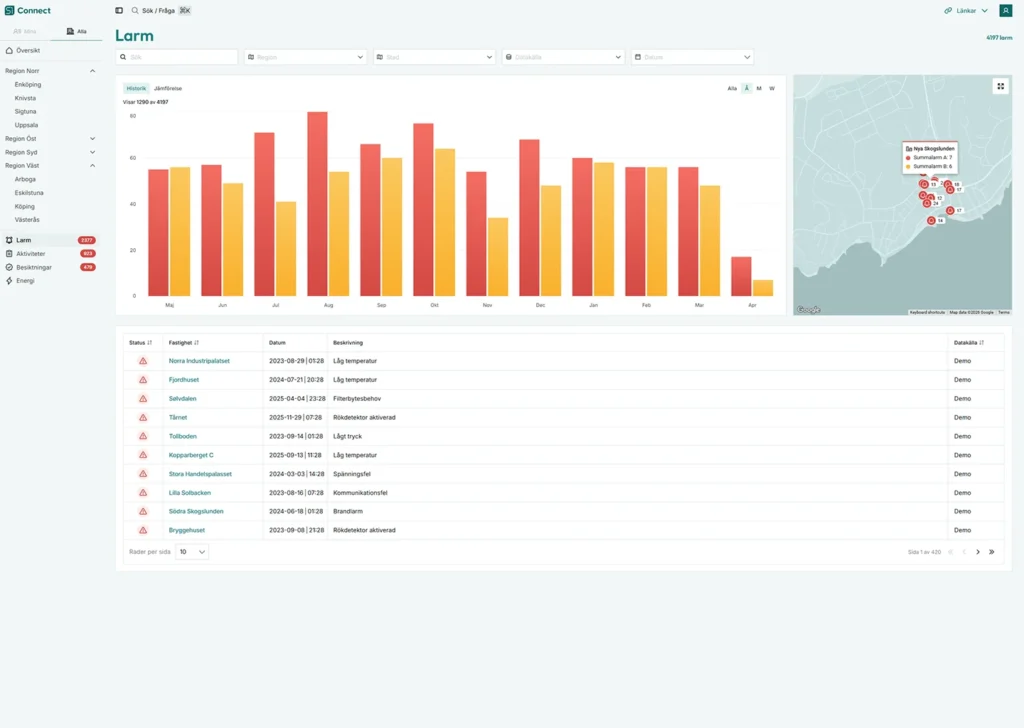
Alarm
All alarms for your properties and inventory are collected here. Operational alarms, leakage alarms, energy alarms, inspection alarms, charging posts, inverters. Simply put, all the alarms you have in your properties, regardless of the system.
- History: How are the alarms trending, are we working away or is it growing?
- Compare: Easily filter and compare between different properties, cities, regions or business areas to see what you need to focus on.
- Links: Varje larm är direktlänkad till det bakomliggande systemet, klicka vidare och kom till rätt plats inloggad
- Status: Has the alarm been assigned to someone, what is the next step to fix the problem so that you can spend time where it is needed and ensure that the alarm does not come back.
- Map view: Use the map to visually see which areas and alarm types need to be prioritized.
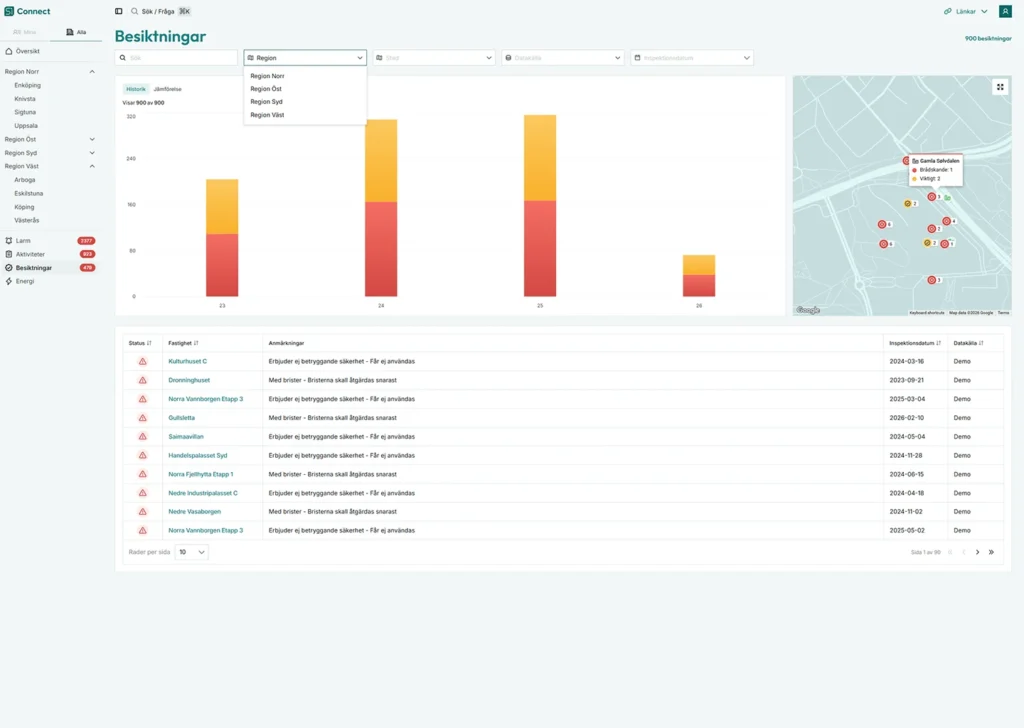
Inspections
Not having full control over your inspections can lead to non-compliance, increased risks and high costs. SI Connect retrieves inspection data from, for example, Dekra and clearly visualizes what, where and when you need to act.
- Historik: Hur trendar besiktningarna, avhjälper med mindre avvikelser eller växer det?
- Jämför: Filtrera och jämför enkelt mellan olika fastigheter, regioner, städer, affärsområden, datakälla, inspektionsdatum för att se vart du skall lägga fokusera.
- Länkar: Varje besiktning är direktlänkad till det bakomliggande systemet, klicka vidare och kom till rätt plats inloggad.
- Kartvy: Använd kartan för att visuellt se vilka områden, fastigheter och besiktningar som behöver prioriteras.
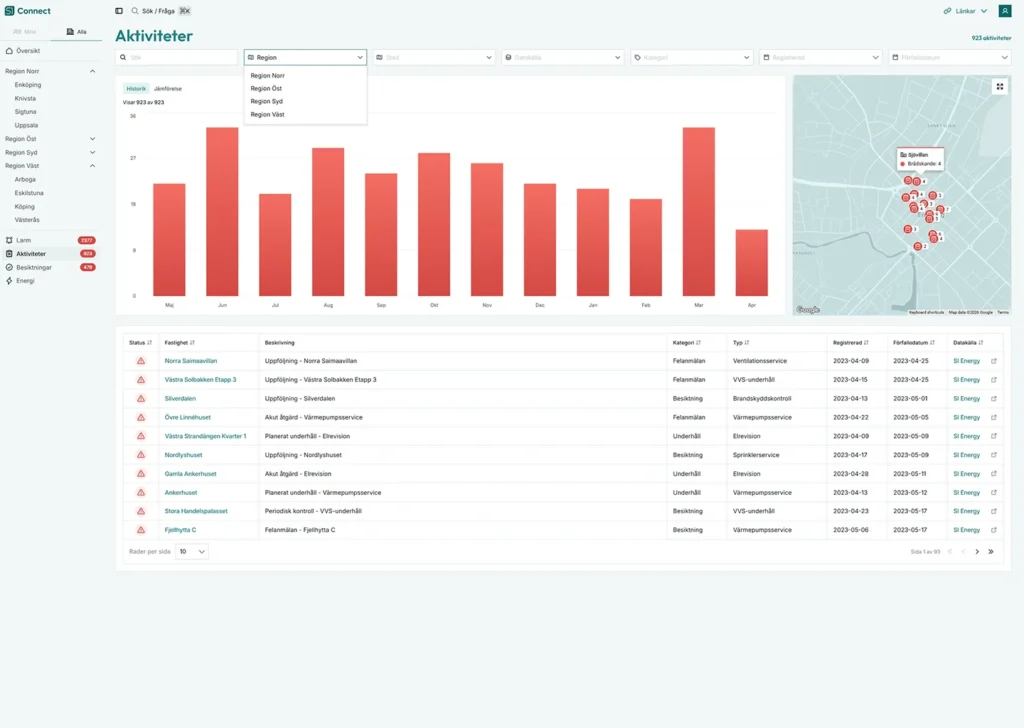
Activities
Här presenteras en samlad vy över alla aktiviteter som ska göras för dina fastigheter eller hela ditt bestånd.
- History: How are the activities trending, are we completing or is it growing?
- Compare: Easily filter and compare between different properties, regions, cities, business areas, data source, category or due date to see which activities to focus on.
- Links: Varje aktivitet är direktlänkad till det bakomliggande systemet, klicka vidare och kom till rätt plats inloggad.
- Map view: Use the map to visually see which areas, properties and activities need to be prioritized.
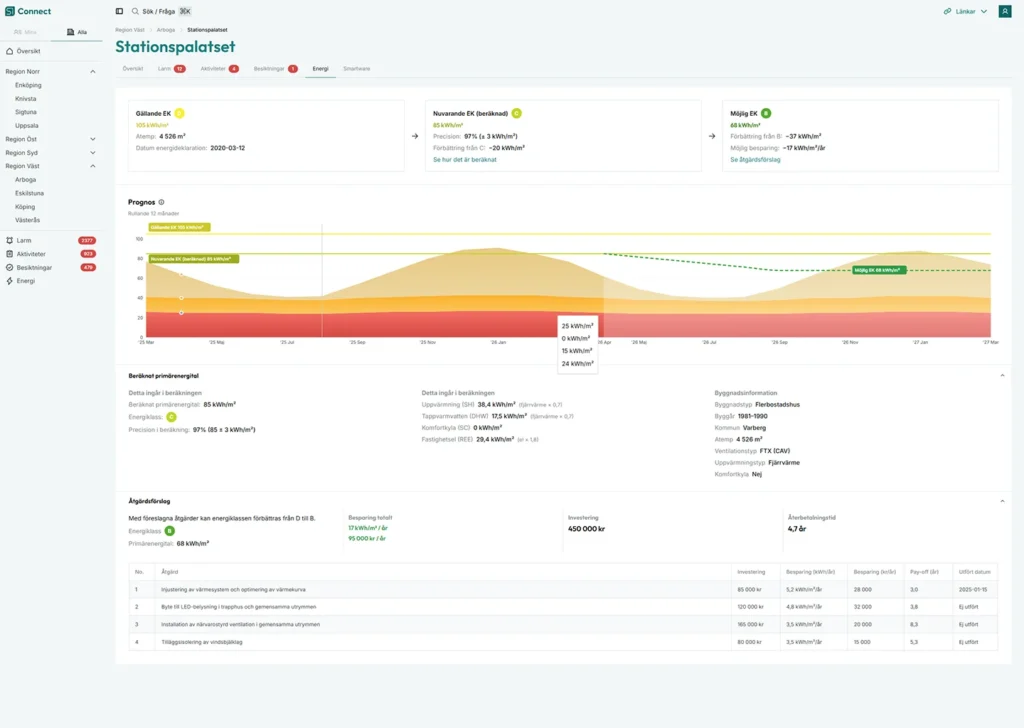
Energy
Under energi får du en tydlig bild över vilka områden och fastigheter som har störst potential till att förbättra energiprestandan. Under respektiva fastighet arbetar du vidare med primärenergital i realtid och koppling av förbättringsåtgärder till energiklass
- Compare: Easily filter and compare energy classes between different properties, regions, cities, business areas to see where you need to direct your energy.
- Applicable energy class: Presentation of the current energy class and date of the last energy declaration.
- Current energy class: Calculation of current primary energy figure and presentation of energy class
- Possible energy class: Work with your proposed improvement measures to see how you can take the step to the next energy class.

Smartware
Smartware är vår AI-tjänst för värmeoptimering och analys som skapar insikter och besparing.
- Heat optimization: AI model that optimizes the heating curve based on weather data, room sensors and operating settings.
- History: See how the curve has shifted over time and the estimated savings.
- Room temperature: See a temperature signature of how the room temperature has changed based on the outside temperature over time.
- Insights: Select operational data and get a simple analysis with insights for what you should review.
Secure data, high IT security
SI Connect is built to handle large amounts of data with high security. We are certified according to ISO 27001:2022 and integrate securely with your existing IT environment.
- Login and authorization control through Microsoft Entra, Open ID Connect and 2FA
- AI-redo och semantiskt strukturerad data enligt standarderna REC 4.0 och BRICK för interoperabilitet
- Cloud-based hosting in Microsoft Azure EU
- API-driven for seamless integrations

SI Connect creates order in complexity
”"Alarms, cases, inspections, fault reports and energy follow-ups are some of the activities that need to be managed, a challenging everyday life for many. SI Connect creates order in the complexity and provides a clear overview of all your properties. Once the data is collected and structured, the possibilities with AI become almost unlimited."”
Sebastian Carlberg
Commercial Product Owner
I want to know more about
SI Connect
Within SI there is both broad and deep knowledge. Our focus is always to listen to our customers to find the best solution together. We warmly welcome you to contact us!